In this post you will learn:
2. How to debug lightning web component Javascript
Salesforce
LWC developers must have Javascript debugging skills to find potential issues
during the development phase. With debugging we can see the output of each line
of code and resolve the issues faster, which results in the completion of the
development tasks in the given duration.
Unlike apex, lightning web component Javascript is executed at the browser and hence we must debug the script at the
browser level.
What
is debug mode?
Debug
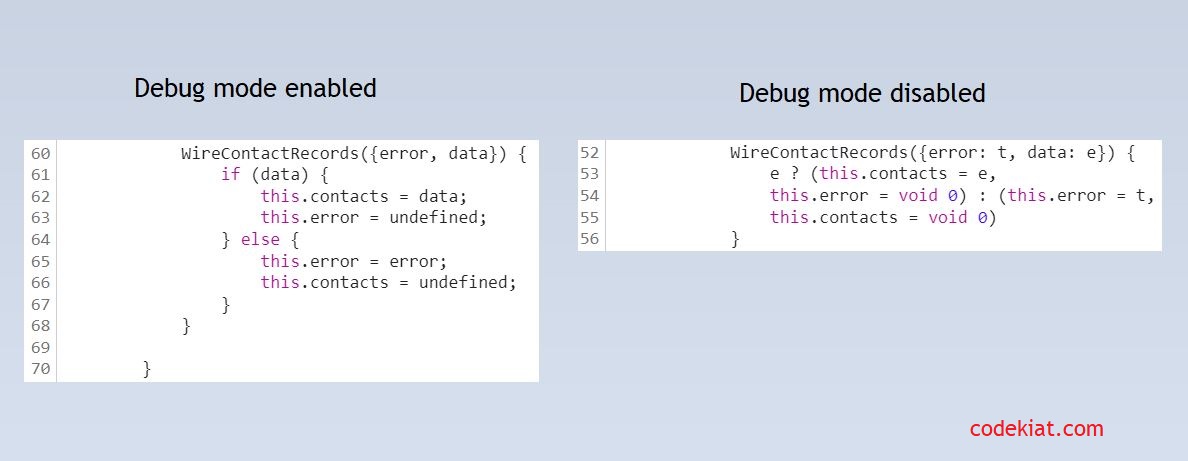
mode downloads detailed or un-minified versions of the Javascript files
in the browser, enabling developers to debug the code line by line. In addition
to this, we can also see the page load times for each page (top right corner of
the Salesforce screen) which is useful when working on the performance issues.
Salesforce is slower for users who have enabled debug mode. Hence, enable it only when required.
Check how to enable debug mode in the salesforce lightning
Do we need to mandatorily enable the
Debug mode for debugging LWC?
Not necessarily. Without debug mode, variable
names are shortened, hence we enable it to see the exact variable names that
are added in the LWC code.
To debug the Javascript, create a simple lightning web component.
LWC
to display related contacts of an account
AccountRelatedContacts.html
<template>
<div>new </div>
<lightning-card title="LWC Record
Id Example">
<lightning-datatable data={contacts} columns={columns} key-field="Id">
</lightning-datatable>
</lightning-card>
</template>
AccountRelatedContacts.js
import { LightningElement, track, wire, api } from 'lwc';
import getContactsRelatedToAccount from
'@salesforce/apex/LwcController.getContactsRelatedToAccount';
export default class AccountRelatedContacts extends LightningElement {
@api
recordId;
@track
contacts;
@track
columns = [
{ label: 'First Name', fieldName: 'FirstName', type: 'text' },
{ label: 'Last Name', fieldName: 'LastName', type: 'text' },
{ label: 'Email', fieldName: 'Email'}
];
@wire(getContactsRelatedToAccount, {accId: '$recordId'})
WireContactRecords({error, data}){
if(data){
this.contacts = data;
this.error = undefined;
}else{
this.error = error;
this.contacts = undefined;
}
}
}
AccountRelatedContacts.js-meta.xml
<?xml version="1.0" encoding="UTF-8"?>
<LightningComponentBundle xmlns="http://soap.sforce.com/2006/04/metadata">
<apiVersion>51.0</apiVersion>
<isExposed>true</isExposed>
<targets>
<target>lightning__AppPage</target>
<target>lightning__RecordPage</target>
<target>lightning__HomePage</target>
</targets>
</LightningComponentBundle>
Apex class
with a method to get the data to LWC
public class LwcController {
@AuraEnabled(cacheable=true)
public static List<Contact> getContactsRelatedToAccount(String accId) {
list<contact> contactList = new list<contact>();
contactList = [SELECT Id, FirstName, LastName, Email, Phone from Contact where AccountId = :accId];
return contactList;
}
}
Consider a scenario, when the newly created LWC doesn’t show expected records in the UI(data table).
We should find what is happening behind the
scenes??
First
step is to make sure that related records are present in the database and the
size of records returned is greater than zero. Add system.debug() points
in the apex code to check the record id passed as an input to apex method, and also
check the size of the contacts returned back to lightning component.
public static List<Contact> getContactsRelatedToAccount(String accId) {
system.debug('accId
>> ' + accId);
list<contact> contactList = new list<contact>();
contactList = [SELECT Id, FirstName, LastName, Email, Phone from Contact where AccountId = :accId];
system.debug('contactList
size >> ' + contactList.size());
return contactList;
}
Fix any issues in the Apex code and make sure expected records are sent to the LWC.
What next?
Debug the lightning web component to find any issues at the browser/client level.
Steps
to debug the Javascript code at the browser level
Note:
Below mentioned steps are applicable to the Google Chrome browser.
Login to Salesforce
Navigate to the screen having the newly created
lightning web component. LWC code gets downloaded and is available in the browser
when the page is loaded.
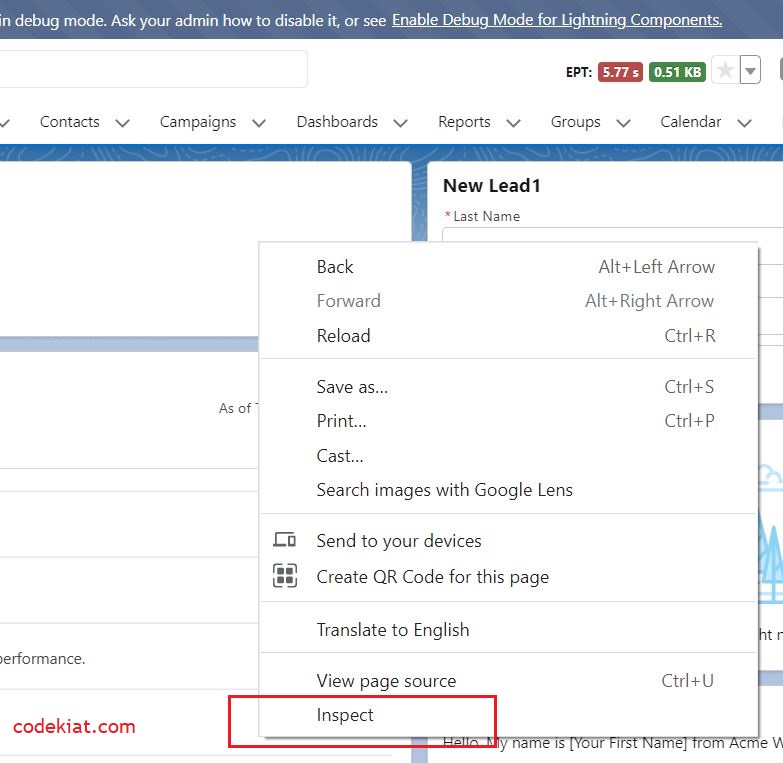
Click F12 or
right-click on any part of the Salesforce page and select Inspect
Developer tools window is launched
If developer tools open in a separate window, click the customize icon (1) and select the Dock to bottom option (2)
This is to visualize the Salesforce record page and developer tools one below the other. Once you get familiar with all the options you can dock the developer tools at any side of the browser.
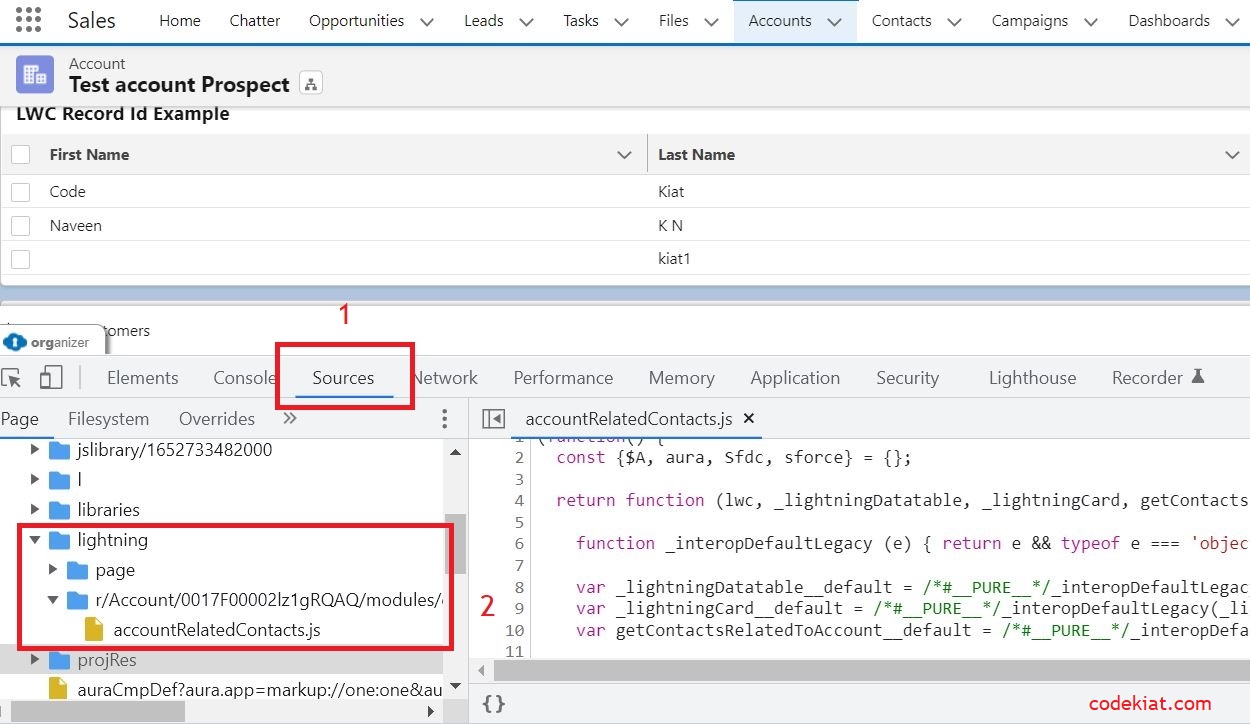
Go to Sources tab (1) and navigate to
lightning > find your component (2), click the component file
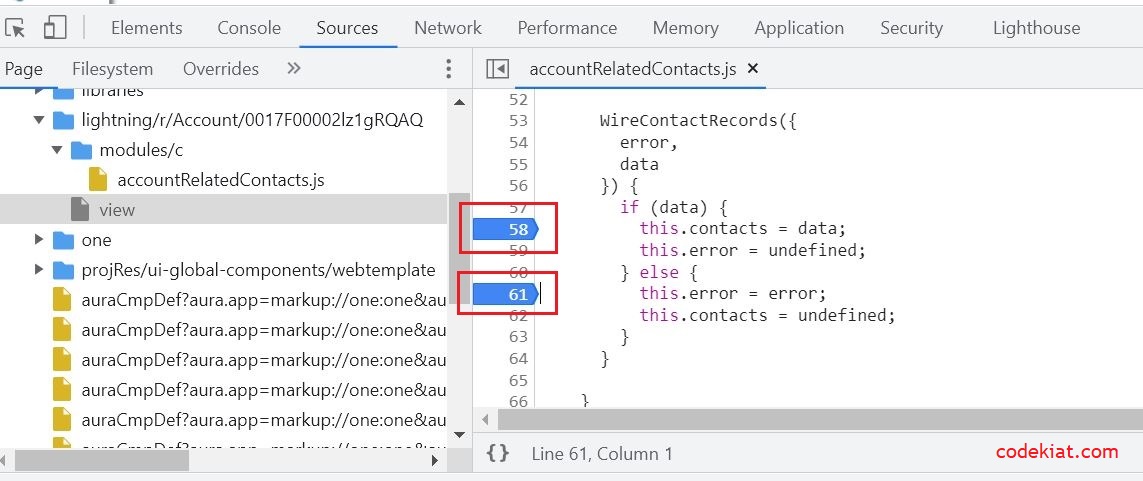
Add breakpoints to the lines from which you want to see the output in the run time.
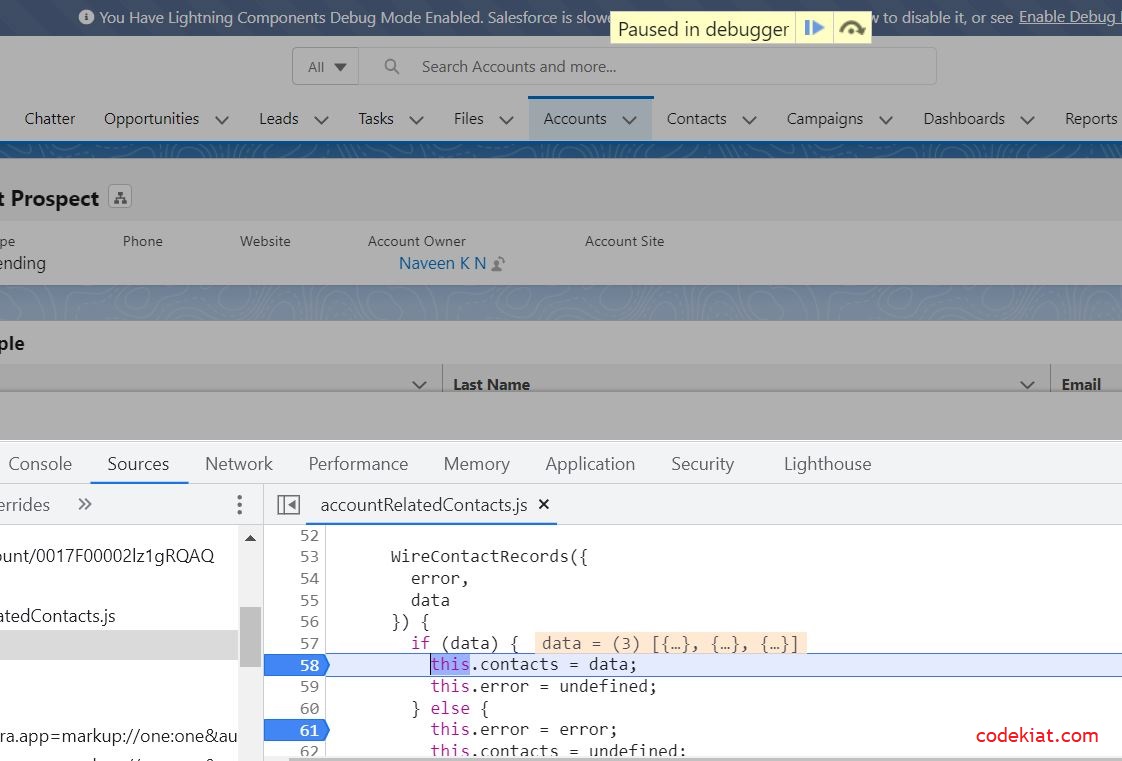
Refresh the screen. Breakpoints will activate, and the context is paused at the line with first breakpoint added in the previous step.
Sometimes context stops at different lines, click F8 until it reaches the first breakpoint selected.
To execute the code line by line use F11 and
to jump directly to the next breakpoint use F8
Hover over a data variable to check the records
retrieved from the apex code.
This way you can debug lightning web component Javascript to make sure each line works as expected.
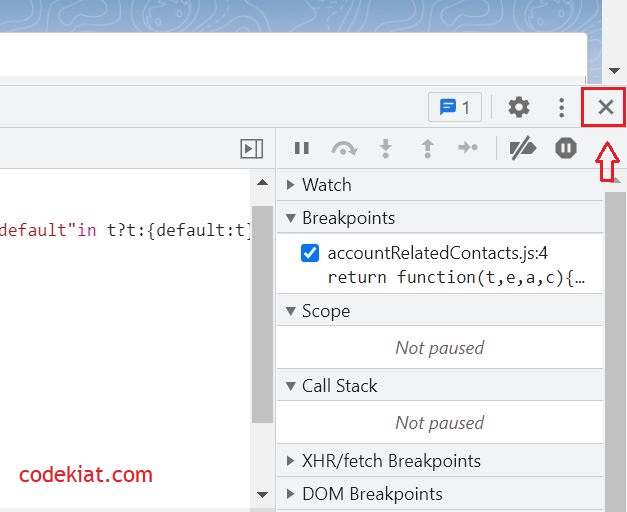
Click X to close the developer tools at any point in time.
To activate or deactivate the breakpoints, click the highlighted icon shown in the below screenshot.
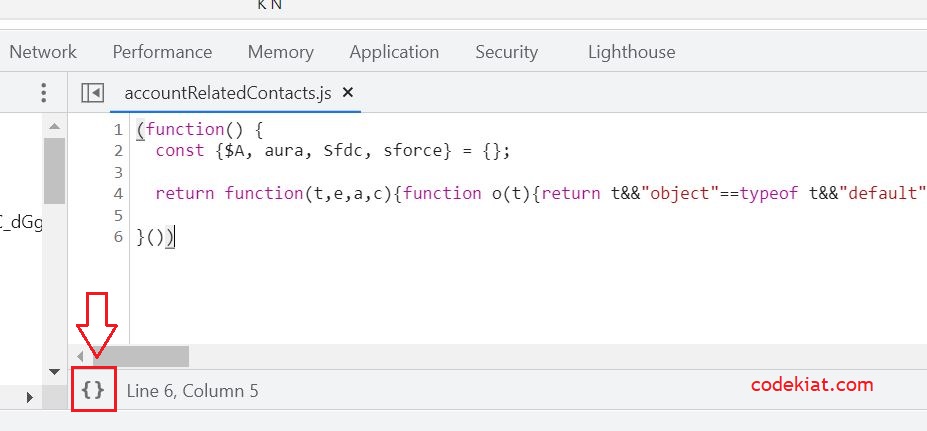
To debug the code without enabling the debug mode, open the lightning web component in the developer tools and click the icon highlighted in the below screenshot.
Wrap
up
We have covered how to debug LWC Javascript with and without enabling the Debug mode in Salesforce.
For starters, debugging steps may look complex. Once you are familiar with all the options and shortcuts in the browser developer tools, it becomes easier to debug.
Debugging
helps to find potential errors and enables developers to complete the task
within the assigned duration. Especially LWCs, without debugging it may consume
plenty of time for the development of complex requirements which will end up in trying
different codes without identifying the exact line causing the issue.
Post
your queries and feedback in the comments section below.
In the upcoming blog post, we will discuss how
to enable field history tracking in Salesforce lightning.
Until then…







0 Comments